orange icon book

Life Science: Unit 2 – Cell Division and Genetics: Lessons

Lesson 1: Introduction to Heredity: Genetic Diversity

Lesson Objective: Heredity is defined as the passing of physical or mental traits genetically from parents to offspring, and scholars learn that genes store our hereditary information (scholars do not know where genes are located or how they obtain our hereditary information yet). They think about the Essential Question and what they might have in common with their friends and family members.

Materials Needed

  • For the teacher: chart paper, paper bag, scissors, Traits Bingo materials and instructions from Genetic Science Learning Center
  • For each group: pictures of different celebrities and parents
  • For each scholar: one piece of PTC paper

Prep

  • Materials Prep:
    • Review the instructions and materials for Traits Bingo.
    • Print photos of different celebrities with their parents in color and cut them into a set of cards for each group.
    • Print a copy of the “Bingo questions” and cut it into strips. Place the strips into a paper bag or other container.
    • Discuss with your manager your intent to use PTC paper in this lab.

What are scholars doing in this lesson?

  • Scholars play a game of Bingo to better understand their observable genetic traits and how common they are compared to those of their peers.

Do Now

Launch

  • Distribute pictures of famous celebrities and their parents.
    • Groups try to pair the parents with their offspring.
    • Scholars share their answers and rationale.
  • Frame the unit without giving too much away. Explain that scholars will build on their understanding of traits from elementary school to learn more about how we get our individual traits in this unit, beginning with a game called “Traits Bingo”!

Activity Activity and materials from Traits Bingo by Genetic Science Learning Center © 2008 University of Utah

  • Scholars inventory their easily observable genetic traits as they play Traits Bingo!

[Engagement Tip: Choose scholars to pick one question at a time from the bag and read it to the class.]

[Tip: If one scholar gets a “bingo” early on, continue playing with a new goal (e.g., two “bingos” on one card) to allow the game to continue.]

  • Collect whole-class data on a few of the traits to see how common they are.
  • As scholars are working, circulate and ask:
    • Where do our traits come from?
    • What do you remember about traits from elementary school?
      • How do you think parents pass traits to their offspring? (Note that in this unit, when we discuss parents, we will be referring to biological parents. Allow scholars to share their ideas about why this might be!)

Discourse Debrief activity:

  • Ask: What patterns do you see in the data?
  • Ask: Which traits do you think people inherit from their biological parents?
    • Define heredity and genes.
    • Explain that each gene controls the production of specific proteins that affect the traits of the individual.
  • Ask: If a trait is not inherited, what else might cause it?
  • Ask: Why are some traits more common than others?
  • Ask: Can you name a specific trait you inherited from a parent? How do you know?
    • Do you share any traits with your grandparents that appear to have “skipped a generation” (meaning they are not present in your parents)? How do you think that happened?

Introduce the Essential Question:

  • Do I have more in common with my friends or my family?
    • Allow scholars to share their initial ideas.

[Parent Investment Tip: Tell scholars to go home and ask their family members about some of the common inherited traits in their family!]

Accountability (Exit Ticket) Note: Do not coach scholars during this Exit Ticket. Instead, allow them to try to answer the Essential Question using their own prior knowledge.

  1. How do you think we inherit traits from our parents? Include evidence and explain your reasoning.

I think we inherit traits by getting some of our parents’ DNA when we are first created. I think that when a sperm and egg combine, they give some of each parent’s traits to the future offspring. For example, maybe the sperm has the eye color trait and the egg has the hair color trait. When the baby is born, he or she already has the traits from each parent in its DNA (even if they don’t show yet).

Scoring Award points as follows:

  1. Score scholars on a 1–4 scale (below expectations through exceeding expectations). Do not penalize scholars for initial misconceptions about content rate them on effort and writing. Use this Exit Ticket to see what scholars remember about traits from elementary school and about sexual reproduction from Sex Education in Grade 5. Use the results of this Exit Ticket to identify current misconceptions among scholars that you will need to revisit later in the unit.
    • Look for the following when scoring scholar responses:
      • A clear claim that answers the question
      • Specific evidence collected from the activity or their prior knowledge that supports the claim
      • Justification/reasoning that ties the evidence to the claim
      • High effort shown in writing, with complete sentences and proper grammar/ punctuation seen throughout the response

Lesson 2: Mitosis and Meiosis (Two Days)

Lesson Objective: Mitosis and meiosis are forms of cell division that differ in both process and product. Meiosis produces the gametes that will ultimately create genetically varied offspring.

Materials Needed

  • For the teacher:
  • For each partnership:
    • For day one: balls of clay (two colors), pipe cleaners (three colors), scissors, cardstock, colored pencils or markers, tape or glue

Prep

What are scholars doing in this lesson?

  • Scholars differentiate between mitosis and meiosis through research and developing a model of cell division.

Day One

Do Now

Launch

  • Discuss:
    • In Unit 1, you learned that all cells come from preexisting cells. How is that possible?
  • Explain:
    • Organisms are constantly producing new cells in order to grow and replace old ones. The process by which new cells are made, as you learned in Unit 1, is called cell division.
    • Let scholars know that there are two main types of cell division that they will learn more about.
  • Introduce the lab:
    • Scholars will explore mitosis and meiosis through a website.
    • Working with a partner, scholars will use materials to model how a cell changes and divides during these processes.
      • Show the available materials.

Research

  • Scholars conduct research on mitosis and meiosis using the Cell Division: Mitosis and Meiosis activity link on their computers.
  • Together with their partners, scholars use clay and pipe cleaners to model and label each stage of mitosis and meiosis on cardstock.
  • Scholars answer the questions below in their Lab Notebooks:
    • Why are there two different processes for cell division?
    • What does each material represent in your model?
  • As scholars are working, circulate and make sure that scholars can identify multiple reasons why cells divide.

[Parent Investment Tip: Display scholar models for the rest of the unit, then send them home to families!]

Discourse Debrief activity:

  • Display two to three scholar models. For each, ask:
    • What happens to a cell during mitosis? How does the model show that? What about
      meiosis?
    • What are the strengths of this model? How could this model be improved?
  • Ask: Why are there two different processes for cell division?
  • Ask: What are the key differences between mitosis and meiosis?
    • Chart these responses in a Venn diagram. Note that this will not be a complete list yet, as scholars will complete additional research on day two.

Make connections to the Essential Question:

  • Ask: How might cell division help you answer the Essential Question?

Accountability (Exit Ticket)

  1. What might happen if a mouse’s cells stopped dividing after it was born? Explain and justify your response. [3]

If a mouse’s cells stopped dividing after it was born, it wouldn’t be able to grow any larger. One reason that cells divide is to create new cells. Because organisms are made out of cells, growing larger requires new cells to be created. New somatic (body) cells are created during cell division through a process called mitosis.

Scoring Award points as follows:

  1. Award one point for each of the following:
    • A claim that identifies one reasonable prediction (lack of growth, death)
    • One piece of evidence to support the claim (should identify at least one reason why cells divide growth, repair, reproduction, etc.)
    • Justification/reasoning that ties the evidence to the claim

Day Two

Do Now

Launch

  • Review:
    • How do cells reproduce? Why is it important that cells reproduce?
  • Review the following points:
    • Define gametes and somatic cells.
    • Explain that humans have 46 chromosomes in each somatic cell. Show the number of chromosomes in other organisms so scholars understand that the number of chromosomes is different in different species.
      • Don’t reveal that human gametes only have 23 chromosomes. Scholars will discover this in the lesson.
  • Introduce today’s lab:
    • You will watch two videos to learn more about mitosis and meiosis.
    • You will make a T-chart to further explain and differentiate between the two processes.

Research

  • Scholars conduct research on mitosis and meiosis by watching as a class:

[Tip: Play each video twice or make them available for scholars to replay at their tables.]

  • Scholars discuss the questions below as a group using their notes:
    • How is meiosis different from mitosis?
    • What is similar about both processes?
    • Do both mitosis and meiosis occur in the same organism? Explain.
    • If a human has 46 chromosomes in a somatic cell, how many chromosomes does a gamete have?
  • Scholars work with a partner to create a T-chart in their Lab Notebooks explaining mitosis and meiosis.
  • As scholars are working, circulate and ensure that they are taking clear, thoughtful notes.

[Tip: Allow scholars to access the Cell Division: Mitosis and Meiosis activity link from the previous lesson to gather additional information.]

Discourse Debrief activity:

  • Show scholars the Mitosis vs. Meiosis diagram. Discuss:
    • How are gametes different from somatic cells?
    • How is the number of chromosomes in somatic cells different than in gametes? Why?
    • Do both mitosis and meiosis occur in the same organism?
    • As the class discusses, identify additional similarities and differences between the processes to add to the Venn diagram from the previous day.

Make connections to the Essential Question:

  • Ask: Does this information make you rethink who you have more in common with? Why or why not?

Make broader connections:

  • Show real video footage of cell division occurring under a microscope. (Hide the video title, if possible.)
  • Ask: Is this a video of mitosis or meiosis? How do you know?

[Parent Investment Tip: Encourage scholars to go home and ask their family members if they know the difference between mitosis and meiosis!]

Accountability (Exit Ticket)

Picture1

  1. Study the image. Does it show the process of mitosis or meiosis?Meiosis
  2. Explain your answer. [1]This is the process of meiosis because meiosis results in four daughter cells.

Scoring Award points as follows:

  1. Award one point for selecting meiosis.
  2. Award one point for one piece of accurate evidence from the diagram that supports their claim (such as the number of daughter cells present at the end).

Lesson 3: Sexual and Asexual Reproduction

Lesson Objective: Chromosomes contain genes, which contain our DNA. Scholars can identify the relationships between sexual reproduction and meiosis and asexual reproduction and mitosis. They also understand why sexual reproduction leads to a combination of traits in each offspring, whereas asexual reproduction creates exact genetic copies.

Materials Needed

  • For each scholar: computer, colored pencils

Prep

What are scholars doing in this lesson?

  • Scholars conduct research to determine how heredity and inheritance are tied to cell division and reproduction.

Do Now

Launch

  • Display a cartoon on cell division. Allow groups to discuss the cartoon, and ask a scholar who gets the joke to explain it.
  • Ask partners to discuss what they recall about cell division from the previous lesson. As a class, discuss:
    • What are the types of cell division? What are the products of each?
    • What are the purposes of each type of cell division?
  • Explain that in this lesson, scholars will deepen their understanding of the connections between heredity and cell division.
  • Ask a scholar to remind the group of the difference between gametes and somatic cells.
    • How is the number of chromosomes in a gamete different from the number in a somatic cell?
    • What part(s) of the body are made up of each type of cell?
  • Explain that to better understand the mechanisms of inheritance, scholars will explore websites that teach them more about reproduction.

Research

[Tip: Provide scholars with effective strategies for note-taking to draw meaning from the video.]

  • As scholars are working, circulate and press them to explain the relationship between DNA, genes, and chromosomes as well as the connection between heredity and cell division.

Discourse Debrief activity:

  • Ask: How is sexual reproduction different from asexual reproduction? Consider both the processes and the products.
    • Define sexual reproduction and asexual reproduction.
    • Define fertilization when it comes up in conversation. (Note that scholars may remember this term from Sex Education classes in Grade 5.)
  • Ask: What is the relationship between sexual reproduction and meiosis?
  • Ask: What is the relationship between asexual reproduction and mitosis?
  • Ask: How are DNA, genes, and chromosomes related?
  • Show the How DNA Works video (first 2 min, 12 sec only) to reinforce these understandings.

Make connections to the Essential Question:

  • Ask: How do the processes and relationship of sexual reproduction and meiosis help you answer the Essential Question? What about asexual reproduction and mitosis?

Accountability (Exit Ticket)

  1. Evaluate the following statement. Explain why you agree or disagree. Address both parts of the statement process and product. You may draw in the space below your lines to help support your response. If you draw, ensure all drawings are very clearly labeled. [3]

Sexual and asexual reproduction differ in both process and product.

I agree with this statement. Sexual and asexual reproduction do differ in process, because sexual reproduction requires two parents, whereas asexual reproduction only requires one. Additionally, they differ in product because sexual reproduction results in genetically unique offspring, whereas asexual reproduction results in offspring that are genetically identical to their parent.

Scoring Award points as follows:

  1. Award one point for each of the following:
    • A claim expressing agreement with the statement
    • Identifying one way in which sexual and asexual reproduction differ in process
    • Identifying one way in which sexual and asexual reproduction differ in product

Lesson 4: Generations of Simple Traits

Lesson Objective: An equal number of traits are passed down from each parent, and an individual’s overall combination of traits makes them unique. Every somatic cell within an organism contains the same exact set of chromosomes.

Materials Needed

  • For the teacher: set of cups and pom-poms to model setup and activity
  • For each group: six labeled cups, pom-poms (six red, six blue, six yellow, six green), colored pencils (to match pom-poms)

Prep

  • Materials Prep:
    • Prelabel a set of cups as shown for each group:
Picture2

Image credit: Module: The Basics and Beyond: An Introduction to Heredity, Generation of Traits by Genetic Science Learning Center © 2006 University of Utah

What are scholars doing in this lesson?

  • Scholars use a fun model to understand how traits are passed on to each generation.

Do Now

Launch

  • Tell scholars they will model the passage of different traits through three generations in a family.
  • Groups discuss: Why do children often resemble their siblings and parents?
    • Scholars formulate and record a hypothesis in their Lab Notebook.
  • Introduce the activity:
    • Scholars will track the traits in gingerbread people to see which are passed on to each generation. The traits will be represented by pom-poms.
Picture3

Image credit: Module: The Basics and Beyond: An Introduction to Heredity, Generation of Traits by Genetic Science Learning Center © 2006 University of Utah

Activity Adapted from Module: The Basics and Beyond: An Introduction to Heredity, Generation of Traits by Genetic Science Learning Center © 2006 University of Utah

Picture4

Image credit: Module: The Basics and Beyond: An Introduction to Heredity, Generation of Traits by Genetic Science Learning Center © 2006 University of Utah

  1. Arrange the cups as shown above and place pom-poms into each cup as follows:
    • Grandfather A – six red
    • Grandfather B – six blue
    • Grandmother A – six yellow
    • Grandmother B – six green
  2. The colored pom-poms represent traits that each of the grandparents have. Color the pom-pom pictures on the Generations of Traits page to show the traits for each grandparent.
  3. Close your eyes and pick one trait from Grandfather A and one trait from Grandmother A and place them in the cup labeled “Mother.” These are the traits that Mother inherited from her parents. Color the pom-pom picture on the worksheet to show the traits Mother has.
  4. Close your eyes again and pick one trait from Grandfather B and one trait from Grandmother B and place them in the cup labeled “Father.” These are the traits that Father inherited from his parents. Color the pom-pom picture on the worksheet to show the traits Father has.[Tip: Scholars may feel silly closing their eyes to “randomly” draw from a cup that only contains one option. Discuss the reason why the activity is designed this way.]
  5. Mother and Father have four children: Mary, George, Elizabeth, and Carl. To determine the traits that Mary will inherit from Mother and Father, close your eyes and take one pom-pom from Mother and one pom-pom from Father. Color the diagram to show the traits that Mary inherited.
  6. Next, return the traits that you took from Mother and Father. (Look at your diagram if you forget where each trait came from.) Now, close your eyes again and choose the traits that George will inherit (one from Mother, one from Father). Color the diagram to show George’s traits.
  7. Return the traits you took from Mother and Father and repeat the process to find the traits for Elizabeth and then for Carl.
  8. Discuss and answer the questions in your Lab Notebook.
    • As scholars are working, circulate and press them to explain what each part of the model represents and how it mimics the real processes that occur when traits are passed from parents to offspring.

Discourse Debrief activity:

  • Share a scholar work sample under the document camera. Ask:
    • What trends do you notice in the data? What can we conclude?
    • How does your data look different from this scholar’s data? Why?
    • What are the limitations of this model?

Make connections to the Essential Question:

  • Ask: Why do we look similar to our family members but not the same?

Accountability (Exit Ticket) Two scholars are having a debate in science class.

Max says, “Sexual reproduction really increases genetic diversity in a population!” Peter replies, “No, Max! It’s asexual reproduction that increases genetic diversity!

  1. Which scholar do you agree with? Explain and justify your response. [3]

I agree with Max, because sexual reproduction contributes to a species’ genetic diversity by creating new combinations of inherited traits. Each offspring inherits traits from both parents, and the results are different for every organism, leading to a variety of unique living things. Genetic diversity is evident even among a group of siblings they are bound to have many traits in common, but each has several unique characteristics as well.

Scoring Award points as follows:

  1. Award one point for each of the following:
    • A strong claim explaining how sexual reproduction leads to genetic diversity
    • At least one piece of relevant, accurate evidence from class that supports the claim
    • Justification/reasoning that supports the evidence

Lesson 5: Mendelian Genetics and Plant Breeding

Lesson Objective: An allele is one of the two or more forms of a gene present in a population. Within an individual organism, a gene may be homozygous (having two identical alleles on a pair of chromosomes) or heterozygous (having two different alleles on a pair of chromosomes). Not all traits are expressed some traits are dominant over others and can be expressed while another recessive trait is carried but does not show outwardly. This is the reason why an organism’s genotype and phenotype are different.

Materials Needed

  • For each group: five F1 pods in resealable plastic bag, five F2 pods in resealable plastic bag (explained in Prep section)
  • For each scholar: a copy of the “Mendel and His Peas” article from Khan Academy

Prep

  • Materials Prep:
    • Smooth and wrinkled peas will be represented by brown “peas” (dried pinto beans) and white “peas” (dried great northern beans), respectively.
    • Peas must be separated into “smooth” and “wrinkled” and then wrapped in foil “pods.”
    • For each group of students, prepare “pea pods”:
      • Cut foil into ten squares (approximately 3 cm × 3 cm, but try one first to get the appropriate size for your beans).
      • Take five squares of foil and place four brown (smooth) pea seeds into each square.
      • Fold foil around the seeds to form the pea pods.
        • Label these “F1 pods.”
      • Count out five white (wrinkled) pea seeds and 15 brown (smooth) pea seeds for the F2 generation.
      • Divide them among the remaining five squares of foil and fold to form the pea pods.
        • Label these “F2 pods.”
      • Place each set in resealable plastic bags for greater organization.
  • Intellectual Prep:

What are scholars doing in this lesson?

  • Scholars use a model of Gregor Mendel’s experiment to reveal the rules of inheritance and the difference between dominant and recessive alleles.

Do Now

Launch

  • Watch the Gregor Mendel Great Minds video (first 3 min, 4 sec).
    • Stop video at 3:04 after Hank yells, “HOW DID HE KNOW THAT? HOW DID HE KNOW?”
  • Tell scholars that is exactly what they are going to find out today by modeling Mendel’s experiment!
    • Scholars will model using foil pea pods and draw meaningful conclusions from the data.
  • They will examine the pea pods produced by crossing a true-breeding round pea plant with a true-breeding wrinkled pea plant. These offspring are known as the first filial (F1) generation.
    • In our model, brown beans will represent smooth peas and white beans will represent wrinkled peas.
  • Scholars share and record predictions about what the “seeds” will look like.

Activity

  • Scholars write a hypothesis about the F1 pea pods and then open them and collect data.

[Materials Management Tip: Scholars should immediately reseal each pea pod after use. This will allow multiple classes to reuse materials.]

  • Scholars record the results as percentages. (You may need to first model calculating percentages.)
    • Scholars share possible explanations for the data.
  • Tell scholars that one of the pea plants from the F1 generation self-pollinated (define if needed) and that the plants that grow from this are known as the second filial (F2) generation.
    • Scholars make predictions about the appearance of these seeds, open the F2 pea pods, and record data on the percentage of brown vs. white peas.
  • Each group develops a conclusion and prepares a presentation of their findings to share during the discourse.
  • Lead guided practice using another trait: stem height. Ensure you are clearly displaying the vocabulary (or perhaps unveiling it in order on a piece of chart paper) as you go, as many new vocabulary words are introduced in this section.
    • As you lead this section, model in a way that feels intuitive to you and will be clear for scholars without using a Punnett square. Scholars will learn about Punnett squares in the next lesson!
  • Sample script for guided practice:
    • In the parent generation of this line of pea plants, I see that Mendel crossed two pure tall plants and two short plants.
      • What percent of offspring were tall from the tall parents in the pure line? (100%)
      • What percent of offspring were short from short parents in the pure line? (100%)
        • This is called the phenotype of the offspring. The phenotype of an organism is the set of observable traits in an organism.
    • I remember how Mendel said there are two “factors” from each parent. Today we call those factors alleles. When two alleles from each parent join, they create the genotype of the organism. The pure tall plants have tall alleles from each parent, which makes them homozygous. We represent these with letters: TT.
    • The genotype of the offspring will also have TT because they received one big T from each parent.
    • What are the phenotype and genotype of the short plants?
      • The short parents produce short plants. That’s the phenotype short. The genotype is tt. The little t’s represent short alleles inherited from each parent.
    • In the next generation, called the first filial, or F1 generation, the offspring from the tall and short plants are crossed. I am going to transfer that information below.
      • What is the phenotype of the offspring in F1? How do you know?
    • Using that information and the same logic about inheritance, I know each plant received one allele from each parent. This means that 100 percent of the offspring in the F1 generation are tall, but each has one T and t allele, making them heterozygous.
      • If each offspring inherited one T and one t, why are they all tall?
        • Discuss dominance and recessiveness of alleles.
  • Scholars work with a partner to determine the phenotype and genotype of the F2 cross. Teachers should coach scholars and then allow a scholar who got it right to present their work.
  • Scholars read the “Mendel and His Peas” article from Khan Academy.
  • As scholars are working, circulate and press them to explain the “rules” of inheritance based on the information they have received.

Discourse Debrief activity:

  • Show a work sample and ask:
    • What are the strengths of this work?
    • What could be changed to improve this work? How would that make it stronger?
  • Continue to show the Gregor Mendel: Great Minds video (next 3 min 7 sec, from 3:04–6:11).
    • Stop the video at 6:11 after Hank describes Mendel’s First and Second Laws of Segregation and discuss.
  • Scholars record Hank’s conclusions in their Lab Notebooks:
    • Offspring inherit one allele (factor for a trait) from each parent.
    • Alleles can be dominant or recessive.
    • Dominant alleles will be expressed more often than recessive alleles.

Make connections to the Essential Question:

  • Ask: How does Gregor Mendel’s work help you to answer the Essential Question?

Accountability (Exit Ticket) Louisa and Ray decide to have a baby. Louisa has brown eyes, and Ray has blue eyes.

  1. What will determine their baby’s eye color? Provide a detailed explanation to support your claim. [3]

The baby’s eye color will be determined by the allele each parent donates for that trait. Each parent has two alleles for eye color, and one will be donated to the baby. Because some alleles are dominant and others are recessive, the baby’s eyes will match the dominant allele it receives.

Note: This response is scientifically accurate but incomplete. At this point in the unit, this is expected scholars can only apply the understanding they have so far!

Scoring Award points as follows:

  1. Award one point for each of the following:
    • A strong claim that reflects understanding of how traits are inherited
    • A piece of evidence from class that strongly supports the claim (must reference alleles, either by name or by describing them conceptually)
    • An explanation that ties the evidence to the claim

Lesson 6: Modeling Genetic Frequency

Lesson Objective: Punnett squares are used to calculate the probability of inheritance of certain traits among offspring. Scholars should feel comfortable both using and analyzing the results of a Punnett square.

Materials Needed

  • For each scholar: scrap paper

Prep

What are scholars doing in this lesson?

  • Scholars practice using Punnett squares as a mathematical model to understand inheritance.

Do Now

Launch

  • Imagine that T can be used to represent the allele for tallness in a plant, whereas t can be used to represent shortness. What are all the possible outcomes for the parental combination of TT and Tt?
    • Allow scholars to find their answers on scrap paper and share out.
  • We see that there are only two options, but what is the probability of each occurring?
    • Allow groups to discuss and calculate and then share responses.
  • A scientist named Reginald Crundall Punnett developed an easier way to determine the probability of every possible outcome in a parental cross: the Punnett square!
  • Model how to complete a Punnett square for the parental combination TT and Tt, and have scholars follow along in their Lab Notebooks.
    • Clearly explain your thinking and ensure that scholars understand that the four boxes in the 2ʺ × 2ʺ square do not indicate the actual results for any four particular offspring. Instead, each box represents a 25 percent chance for any one offspring to inherit that combination of alleles.
    • As you demonstrate, make sure to reinforce the following concepts and vocabulary:
      • Heterozygous/homozygous
      • Dominant/recessive
      • Genotype/phenotype
      • Parental alleles
  • Lead additional guided practice using the “My Dog Spot” section in the Lab Notebook. As a class, complete the steps and discuss whether “Spot” is actually an appropriate name for Spot or not!
  • Tell scholars that today they will practice using Punnett squares and that this skill is a form of mathematical modeling!

Activity

  • Tell scholars exactly what you expect them to do to show thinking work and effort on Punnett square questions.
  • Scholars practice using Punnett squares in their Lab Notebooks, checking in with group members and discussing as needed to ensure they agree on their responses.
  • As scholars are working, circulate and complete the following:
    • Coach scholars to ensure correct usage of Punnett squares.
    • Take note of two or three challenging questions to work through together as a class, and identify exemplar work samples to display.

Discourse Debrief activity:

  • Work through the challenging questions you identified as a class. Show the exemplars you identified.

[Engagement Tip: Allow scholars who were successful to lead this portion.]

  • Why is it impossible for offspring to show a recessive trait if one parent is homozygous for a dominant trait?
  • How can Punnett squares help you predict patterns and frequency of inheritance?
  • How do Punnett squares help you to understand the relationships between chromosomes, genes, DNA, and alleles?
    • Show visuals to support these relationships.

[Tip: These are abstract concepts that scholars will delve into more deeply during high school. For now, simply reinforce the idea that DNA located on chromosomes, which are inside the nucleus of a cell carries the genetic information.]

Make connections to the Essential Question:

  • Apply your understanding from today’s lesson to the Essential Question.

Accountability (Exit Ticket) A scientist has some red-eyed fruit flies. She knows that red eyes are dominant over white eyes in fruit flies. She is studying the fruit flies and wants to find out if they are homozygous or heterozygous for eye color.

  1. What is one way that she could find out if the red-eyed fruit flies are homozygous for eye color? Explain. [2]One way she could find out if the red-eyed fruit flies are homozygous is by breeding them with white-eyed fruit flies. If the red-eyed fruit flies are homozygous, the allele for red eyes will always be dominant over the white and all the offspring will have red eyes. However, if the red-eyed fruit flies are heterozygous, there is a chance of an offspring receiving the allele for white eyes from each parent, producing white- eyed offspring.
  2. Use a Punnett square to show and then explain below what will happen if homozygous red-eyed fruit flies are crossed with white-eyed fruit flies. Use R to represent red eyes and r to represent white eyes. [4]Picture5If the red-eyed fruit flies are homozygous, they will always donate an allele for red eyes (R) to every offspring. Because R is dominant, all offspring will end up with red eyes, because the allele for red eyes will be dominant over the allele for white eyes.
  3. If heterozygous red-eyed fruit flies are crossed with white-eyed fruit flies, what is the probability of an offspring having red eyes? Show your work in the space below and circle your final answer. [3]Picture6

Picture7

Scoring Award points as follows:

  1. Award one point for each of the following:
    • Identification of one scientifically accurate method the scientists could use
    • At least one piece of evidence from class that strongly supports the claim (must demonstrate understanding of the terms homozygous and/or heterozygous and must reference probability either directly or indirectly)
  2. Award one point for each of the following:
    • Scholar correctly labeling Punnett square
    • Scholar correctly filling in Punnett square
    • Scholar recording accurate percentages for each trait
    • Scholar including a written response that summarizes their findings
    • Note: To avoid double jeopardy, scholars may receive partial credit if they use the Punnett square incorrectly but provide an accurate explanation for the results they received.
  3. Award points for each of the following:
    • Scholar correctly labeling Punnett square
    • Scholar correctly filling in Punnett square
    • Scholar recording accurate percentages for each trait and circling their final answer

Lesson 7: More Complex Patterns of Inheritance

Lesson Objective: Not all patterns of inheritance follow the simple rules of Mendelian genetics. Instead, other forms of gene expression exist, such as codominance and incomplete dominance.

Materials Needed

Prep

  • Materials Prep:
    • Print one copy of the work packet for each scholar.
    • Create parent dragon models for class demonstration.
  • Intellectual Prep:

What are scholars doing in this lesson?

  • Scholars uncover new patterns of inheritance using a model that incorporates other forms of gene expression.

Do Now

Launch

  • Show scholars your models of the two parent dragons. Have scholars identify different dragon traits.
  • Explain that today scholars will study how traits with a variety of methods of inheritance affect the phenotype of a group of offspring.
  • Review the procedure in the work packet thoroughly.

Activity Adapted from Alabama Learning Exchange’s “Dragon Genetics” activity

  • Pairs complete the lab procedure.
    • Scholars take turns flipping coins to determine the alleles inherited by their dragon offspring. This method will be used to determine several traits.
    • Scholars determine the sex of their offspring by flipping a coin to discover if their dragon has ear frills, the sex chromosome donated by the male dragon.
    • Scholars build the offspring they created using the provided materials.

[Tip: Scholars are usually surprised at the variety of siblings. Point out that only a few traits are considered in this activity; with more traits, there would be even more diversity!]

  • As scholars are working, circulate and ask them to explain in their own words how traits are inherited. Ask:
    • Which characteristics do not seem to follow a simple dominant/recessive pattern? What pattern do they seem to follow?

[Parent Investment Tip: Encourage scholars to take their dragons home and explain their work to their parents!]

Discourse Debrief activity:

  • Discuss the similarities and differences in the siblings made by the class. Ask:
  • Why is there so much variation in the siblings?
  • Which characteristics show a simple dominant/recessive pattern?
  • Which characteristics do not seem to follow a simple dominant/recessive pattern? What pattern do they seem to follow?
    • Define codominance and incomplete dominance.

Make connections to the Essential Question:

  • Ask: How do your new understandings from today’s lesson help you answer the unit’s Essential Question?

Accountability (Exit Ticket) The top row in the picture below shows two different plants with different genes for flower color (pure red and pure white). The plants on the bottom are the result of breeding one pure red-flowered plant with one pure white-flowered plant. Use the picture to answer the question that follows.

Picture8

Image credit: Khan Academy

1. Does the offsprings’ flower color best represent a Mendelian pattern of inheritance, codominance, or incomplete dominance? Explain your response using evidence from the picture. [2]

This offspring’s flower color is an example of incomplete dominance. Incomplete dominance occurs when one allele does not completely dominate another and a new phenotype is created. Here, you can see that the two traits (red flowers and white flowers) are blended into a new phenotype: pink flowers.

The two cows pictured below each carry a dominant trait for coat color: one for a black coat (BB) and one for a white coat (WW). Use the picture to answer the question that follows.

Picture9

2.If a pure black male cow and a pure white female cow mated, what might their offspring’s coat look like? Shade in the picture below using your pencil to show one possible phenotype for the baby cow. [1]

Picture10

Exemplar:

Picture11

Scoring Award points as follows:

  1. Award one point for each of the following:
    • Identifying incomplete dominance
    • Explaining how the pictures show incomplete dominance using at least one piece of valid evidence from class

2.Award one point for shading in the baby cow to show that the black and white fur are codominant.

Note: The pattern/distribution does not need to be a realistic cow pattern stripes, for example, may be awarded full credit.

Lesson 8: Patterns in Pedigrees

Lesson Objective: Pedigree charts support scientists in analyzing the genotype and phenotype of a related group of organisms over several generations.

Materials Needed

Prep

What are scholars doing in this lesson?

  • Scholars practice using pedigree charts to examine phenotypic and genotypic inheritance of related organisms over several generations.

Do Now

Launch

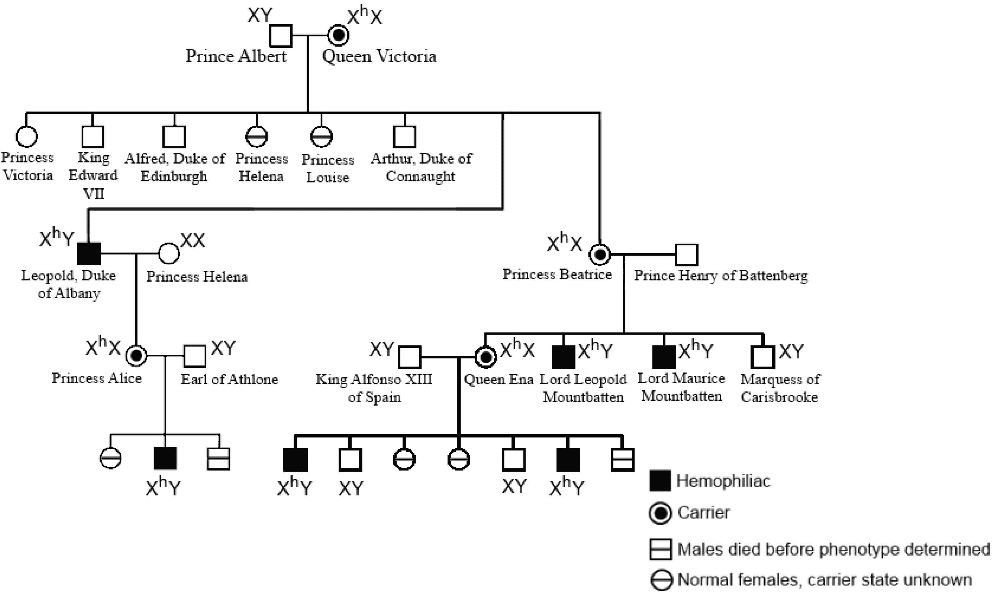
  • Show scholars a pedigree of Queen Victoria’s family showing hemophilia phenotypes, genotypes, and carriers.
Picture12

Image credit: CKRobinson, CC BY-SA 4.0, via Wikimedia Commons

  • How is it organized?
  • Scholars preview the work packet and develop rules they think will hold true for reading or constructing a pedigree. Rules may include the following:
    • Pedigrees always have a title and key.
    • Females are represented by circles and males by squares.
    • Members of the same generation are aligned horizontally.
    • Partners are connected by a horizontal line.
    • Offspring are connected to their parents with a vertical line.
  • Summarize rules as a class and display them on a viewable screen during the lesson.
  • Explain that scholars will have the opportunity to practice using pedigree charts to better understand how they work. This will give them additional insight to help them answer the Essential Question!

Activity

  • Scholars follow the procedure detailed in their work packet:
    • Scholars investigate pedigree charts and discuss the questions for each example.
  • As scholars are working, circulate and coach those who are struggling to use a pedigree chart. Diagnose the issue and provide transferrable feedback.

Discourse Debrief activity:

  • Ask: What are the advantages and disadvantages of using pedigrees, rather than breeding studies, to gather genetic information?
  • Ask: How is a pedigree chart different from a Punnett square?
  • Ask: Discuss one to two questions from the work packet that were challenging for the class. Use scholar work samples to guide the discourse around these questions.

Make connections to the Essential Question:

  • Ask: How do pedigree charts help you answer the Essential Question?

Accountability (Exit Ticket) The pedigree chart below tracks the inheritance of a hereditary genetic disorder through several generations in a family. Family members who have expressed the disorder are represented by shaded symbols.

Picture13

  1. How many generations of this family are represented on this pedigree chart? [1] 4
  2. How many children did Justin and Anna have? [1] 4
  3. How many family members have the genetic disorder? [1] 4
  4. Dan marries a woman named Terri who does not have the disorder, and they have a son named Jason. He also does not have the disorder. Draw these additions to the family on the pedigree chart above. [3]

Picture14

5.If Alec and Tracey have another child, is it possible for the child to have the disorder? Explain your response. [2]

It is possible for Alec and Tracey’s next child to have the disorder. Even though neither Alec nor Tracey have the disorder, Alec’s father does, so Alec could be a carrier. Because we do not have information about Tracey’s family pedigree chart, it is possible that she is also a carrier. Therefore, their offspring could potentially inherit the disorder even though neither of their parents has expressed it.

Scoring Award points as follows:

  1. Award one point for stating that there are four generations represented on the chart.
  2. Award one point for correctly stating that Justin and Anna had four children.
  3. Award one point for stating that four family members have the disorder.
  4. Award one point for each of the following:
    • Correct placement of both family members
    • Correct shape to identify each family member as male or female
    • Correct shading to show that neither Terri nor Jason has the disorder
  5. Award one point for each of the following:
    • An accurate claim (technically it is possible for Alec and Tracey’s child to have the disorder, as carriers do not seem to be indicated on this pedigree chart, but strong arguments either way can be accepted)
    • A relevant, clear explanation that strongly supports the claim

Lesson 9: Cell Specialization, Gene Expression, and Mutations

Lesson Objective: Cells are specialized to perform different functions within the body. Errors (such as mutations) that occur during cellular division and differentiation / specialization processes can affect the DNA within a cell. If not corrected by the body, these errors can cause changes in an organism. These changes can be beneficial, neutral, or harmful.

Materials Needed

  • For each group: paper bag containing “specialized cell” cards
  • For each scholar: small ball of red clay (about the size of a golf ball), computer/device

Prep

  • Materials Prep:
    • Make one ball of clay for each scholar. Each should look identical to begin the lab.
    • Print the “specialized cell” cards and cut them apart. Place one set in a paper bag for each group.
  • Intellectual Prep:

What are scholars doing in this lesson?

  • Scholars examine the processes of cell differentiation through research and diagramming to understand how errors in DNA can cause changes in an organism.

Do Now

Launch

  • We know that cells divide to create new cells. We also know that complex organisms such as humans have several types of cells. But how does a cell become a skin cell, a blood cell, or a nerve cell? Today we will find out!
    • Note: Although this lesson is launched almost like an “Explore” lesson, scholars will be expected to solidify their conceptual understanding of both mutations and cell specialization by the end of this lesson, hence the classification of this lesson as an “Explain.”
  • Scholars watch the What Is DNA and How Does It Work? video (5 min, 23 sec) to learn how new DNA is created in more detail and take notes.

Activity

  • Scholars select a card from the paper bag without looking.
  • Scholars use one ball of clay to form a cell that matches the card they chose. Then they discuss:
    • Everyone started with the same basic “cell” represented by a red sphere. What did you do to change your cell into a specialized cell?
    • How do you think cells really complete these transformations?
    • Scholars learn how cells specialize by watching the Cell Differentiation video from Khan Academy (2 min, 50 sec).
  • Scholars create a diagram to show how stem cells can turn into several specialized cells.
  • Reflecting on the processes of transcription and translation, scholars consider what happens when the “copy/paste” process goes wrong. They discuss this as a group and bring their ideas to the discourse.
  • As scholars are working, circulate and insist on thoughtful note-taking and the creation of accurate diagrams that reflect their best effort.

Discourse Debrief activity:

Make connections to the Essential Question:

  • Ask: How does cell differentiation and mutations add to our understanding of the Essential Question?

Accountability (Exit Ticket) After studying the link between exposure to the sun’s UV rays and skin cancer, Molly says, “All mutations are so dangerous! I hope I never have one!”

  1. Should Molly be afraid of a genetic mutation occurring in her body? Explain your response. [2]

Molly should not be worried about a genetic mutation occurring in her body. In fact, they happen frequently, so Molly’s DNA has likely already experienced many mutations over the course of her life! A mutation is an “error” that occurs when DNA is replicated. This error could mean that individual genes are inserted, eliminated, or changed, and these changes may be beneficial, neutral, or harmful. Not all mutations have serious consequences like cancer, so she should only worry about the ones that are actually harmful.

Scoring Award points as follows:

  1. Award one point for each of the following:
    • A strong claim that is supported by compelling evidence
    • An explanation that strongly supports the claim and incorporates valid reasoning from class

Note: Scholars may argue either way as long as their claim is clear and defended by relevant evidence from class.

Lesson 10: Selective Breeding

Lesson Objective: Selective breeding is a practice in which a person chooses certain organisms to breed based on their expression of certain traits.

Materials Needed

Prep

What are scholars doing in this lesson?

  • Scholars participate in a simulation of chicken farming and apply their knowledge of inheritance to reveal the practice of selective breeding.

Do Now

Launch

  • Tell scholars that today they will put their understanding of inheritance to the test as they compete against their classmates to make the most profit in a chicken-farming simulation!
  • In the simulation, they will make decisions about the chickens they will breed and sell, applying their knowledge of inheritance to maximize their profits!

[Engagement Tip: Allow each group to come up with a name for their farm before the competition begins!]

Activity

  • Scholars act as farmers, raising chickens through several generations. In each round, they complete the following:
    • Select chickens to breed (five breeding pairs per round).
      • Note: In round 1, all groups begin with ten hens and ten roosters, whose genotypes for a trait that strongly influences body size are as follows:
        • Hens: cc, cc, cc, cc, cc, cc, Cc, Cc, Cc, CC
        • Roosters: cc, cc, cc, cc, cc, cc, Cc, Cc, Cc, CC
    • Scholars create Punnett squares to determine the possible genotypes of each offspring from each breeding pair. Then they roll dice to determine which alleles the offspring will inherit and record the data.
    • Scholars select chickens that will not be bred during the next round, sell them, and record the profits ($2.00 per pound).
    • All older chickens are now “retired” and cannot be sold or used to breed in the next round.
  • After breeding four generations, scholars total their profits.
  • As scholars are working, circulate and press them to explain the decisions they are making regarding which chickens to breed or sell.
    • Scholars should be applying their understanding of Mendelian genetics to strategically breed the chickens that will produce the largest (and therefore most valuable) offspring.
    • Press them to consider whether it is worth selling off the bigger chickens immediately versus keeping them to breed.

Discourse Debrief activity:

  • Share class data. Identify the group who earned the most profit from their sales.
  • Ask: How did you apply your understanding from this unit to attempt to increase your profits?
    • Select one scholar from the group with the highest profits. Show their work as they narrate a segment of their team’s process. Ask the scholar to explain how they applied their understanding from earlier lessons to guide their decision-making.
    • When scholars describe selective breeding, introduce and define the term. Explain that people have been selectively breeding other organisms for thousands of years!
  • Why did you have to roll dice to determine the final genotype of each offspring?

Make connections to the Essential Question:

  • Ask: Does selective breeding apply to the Essential Question? Explain.

Accountability (Lab Notebook)

  • This lesson has no Exit Ticket. In place of an Exit Ticket, grade scholars’ work in their Lab Notebooks.

Scoring Award points as follows:

  • Award a score between 1 (below expectations) and 4 (exceeding expectations). Look holistically for accurate application of the major concepts from this unit in a way that demonstrates full understanding.
    • Look for the following when scoring scholar work:
      • Clear and noted genotypes recorded in each round
      • Complete Punnett squares for offspring in each round
      • Clear and labeled calculation of profits in each round
      • High effort shown throughout the work

Lesson 11: Genetic Engineering

Lesson Objective: Genetic engineering is a process in which a person alters the actual DNA of an organism in the hope of producing a certain desired result in that organism.

Materials Needed

  • For each scholar: computer/device

Prep

What are scholars doing in this lesson?

  • Scholars conduct research on selective breeding and genetic engineering to determine future impacts on society.

Do Now

Launch

  • As the class learned yesterday, it is sometimes possible to “manipulate the odds” to increase the occurrence of desirable traits in offspring. This can be applied to more than just chickens: Farmers can use similar processes to get their tomato plants to produce bigger tomatoes, and breeders can strategically select dogs to ensure that more puppies in a litter are born with spots or a curly tail.
  • Over the past several years, people have begun to wonder: How far can this go? Is it possible that in the future you’ll visit a doctor’s office to pick out your future child’s eye color or hair color?
  • Today you will conduct research that will help you answer the questions above on both selective breeding, which you discovered yesterday, and genetic engineering, a new concept you will learn about. As a class, we will come together to discuss your findings and thoughts.
    • Allow scholars to discuss the following in groups before getting started:
      • Have you ever heard of genetic engineering? If so, what have you heard about it?

Research

Discourse Debrief research:

  • Ask: What is the difference between selective breeding and genetic engineering?
  • Discuss the guiding questions as a class. Allow for several perspectives and press scholars to evaluate one another’s responses.
    • Do you feel there are ethical concerns with selective breeding? What about genetic engineering? Why?
    • Should the government “draw a line” somewhere, limiting certain practices or making them illegal? If so, where should the line be drawn?
  • Give scholars an additional ten minutes to go back and revise their work based on their takeaways from discourse.

Make connections to the Essential Question:

  • Ask: Could selective breeding or engineering influence your answer to the Essential Question? What about scholars studying this unit in 50 years?

Accountability (Lab Notebook)

  • This lesson has no Exit Ticket. In place of an Exit Ticket, grade scholars’ position statements in their Lab Notebooks.

Scoring Award points as follows:

  • Score scholars on a 1–4 scale (below expectations through exceeding expectations).
    • Look for the following when scoring scholar responses:
      • A clear, focused, and compelling claim that unites the piece
      • Consistently chooses the most illuminating and relevant evidence to support the claim
      • Groups related evidence to build momentum and prove the claim
      • High effort shown in writing, with complete sentences and proper grammar/ punctuation seen throughout the response

Lesson 12: Gummy Bear Genetics (Two Days)

Lesson Objective: Scholars have the opportunity to demonstrate their mastery of the unit goals! They should be able to articulate several causes of genetic diversity, predict patterns of inheritance and model them mathematically, and compose a robust answer to the unit’s Essential Question.

Materials Needed

  • For the teacher: display the data table on a viewable screen (for recording class data)
  • For each group: colored pencils, prepared paper bag of gummy bears

Prep

  • Materials Prep:
    • Prepare in advance by placing bears in numbered paper bags, making sure to include predetermined numbers of different colored bears to represent Mendelian and non-Mendelian ratios. Use a marker to make the bears in cross #7 spotted.
    • Examples of the numbers you can use are shown in the “Phenotypic Frequency” column below. It is important to remember to vary the numbers of bears slightly from ideal ratios to be somewhat realistic: For example, you can use 31:9 or 29:11 (instead of 30:10) to simulate a 3:1 ratio.
    • Because there are only seven crosses, you may need to make doubles of some bags for additional groups of scholars.

Sample Student Data for Six Genetic Crosses

Cross # Phenotypic Frequency Ratio Possible Genotypes Mode of Inheritance Most Likely Parental Cross

1

25 red

100%

RR or Rr

Mendelian

RR x RR or RR x Rr

2

24 colorless

100%

rr

Mendelian

rr x rr

3

37 red/12 colorless

3:1

RR/rr

Mendelian

Rr x Rr

4

26 yellow

100%

YY

Codominance or Mendelian

YY x YY

5

30 orange

100%

RY

Incomplete dominance

RR x YY

6

11 red /20 orange /9 yellow

1:2:1

RR/RY/YY

Incomplete dominance

RY x RY

7

25 yellow with red spots

100%

RY

Codominance

RR x YY

What are scholars doing in this lesson?

  • Scholars use a gummy bear model and showcase their knowledge from the unit to determine different causes of genetic diversity.

Day One

Do Now

Launch

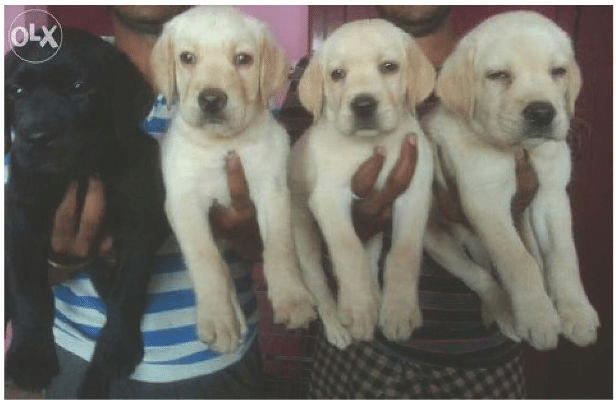
  • Show the photo below:
Picture15

Image credit: Firoz111, CC BY-SA 4.0, via Wikimedia Commons

  • Ask: Do you think the puppies’ inheritance of fur color was Mendelian? Why or why not?
  • Ask: What do you think the genotypes of these puppies’ parents are? Why?
  • Chart scholar responses to this question, as it will arise again at the end of the lesson!
  • Explain to scholars that over the next two days, they will have the opportunity to take on a final challenge that will show off their understanding from the unit.
  • Have each group select a numbered paper bag, and explain that the bears in each bag are the result of a different crossbreeding experiment.
  • Describe how scholars will complete the experiment:
    • Tell scholars that they will extend their knowledge of complex patterns of inheritance by proposing and testing hypotheses to explain Mendelian and non-Mendelian genetic patterns of gummy bear populations.

Activity Adapted from William P. Baker and Cynthia L. Thomas’s “Gummy Bear Genetics,” November 1998

Note: This activity is lengthy and has been split to be completed over two days.

  • Scholars follow this procedure:
    • Each group opens one bag and records the total number of bears in their Lab Notebooks. These bears represent the F1 generation of a crossbreeding experiment.
    • Scholars empty the contents of the bag onto the table and sort the gummy bears into groups based on phenotypic differences that can be easily observed and quantified. (Note that some groups will receive a uniform group of offspring and may choose not to split them apart.) Groups discuss:
      • Did you choose to split your gummy bears into groups? If so, what is the phenotypic characteristic you used to sort the bears?
    • Scholars count the number of individual bears for each of the alternate forms of this characteristic and fill in the table below for their bag.

Picture17

  • As scholars are working, circulate and press those who are struggling to apply their knowledge from previous lessons.

Discourse Debrief activity:

  • Scholars share and record a class set of data and discuss:
    • Which trait(s) appear to be dominant? How do you know?
    • Which type of inheritance is exhibited by your sample of bears? How do you know?

Make broader connections:

  • Ask: How do scientists study genetic inheritance in the real world?

Accountability (Exit Ticket) Read the excerpt below about the formation of fraternal twins and then answer the question that follows.

Fraternal Twins

By Donna Krasnewich, M.D., Ph.D.

Fraternal twins are also dizygotic twins. They result from the fertilization of two separate eggs during the same pregnancy. Fraternal twins may be of the same or different sexes. They share half of their genes just like any other siblings. In contrast, twins that result from the fertilization of a single egg that then splits in two are called monozygotic, or identical, twins. Identical twins share all of their genes and are always the same sex.

Picture19

Fraternal twins are also called dizygotic twins. And the difference between fraternal and identical twins is that fraternal twins derive from two different eggs. Fraternal twins may be the same gender, they may have many of the same characteristics, but they also may be very different from each other and, in fact, share half of their genes, just like their sisters and brothers. It’s important to recognize that the difference between fraternal twins and monozygotic, or identical, twins is that monozygotic twins result from the fertilization of a single egg with a single sperm, and then, during the embryonic development or during the cell splits, those massive eggs split into two individuals, which later develop into two offspring.

Excerpt courtesy of National Human Genome Research Institute

  1. How is it possible that a set of twins can look different from each other? Explain your response using evidence from the excerpt above and your knowledge from the unit. [2]

It is possible for twins to look different because they are not genetically identical. The excerpt above states that fraternal twins are each made with their own egg and sperm, and I know that each egg or sperm contains a unique combination of alleles from a parent. For example, the sperm might contain the allele for blond hair, whereas another may contain the allele for brown hair, even if they come from the same father. Thus, siblings inherit unique combinations of traits from their parents, even if they are twins.

Scoring Award points as follows:

  1. Award one point for each of the following:
    • Citing evidence from the passage that helps to explain the occurrence of twins
    • Supporting evidence from class and an accompanying rationale that clearly and accurately answer the question

Day Two

Do Now

Launch

  • Review the results from the class data of the previous day’s lab. Ask:
    • Which trait(s) appear to be dominant? How do you know?
    • Which type of inheritance is exhibited by your sample of bears? How do you know?
  • Today scholars will collect class data about their individual populations and learn how to represent codominant traits in a Punnett square to help them discover the alleles within this population of gummy bears.

Activity

  • Scholars select gene symbols (letters) to represent the alleles for the characteristic they studied. Groups discuss:
    • Based on the evidence, what are the probable genotypes for each phenotype you observed?
    • What were the probable genotypes of the original parental cross that created the bears in your bag?
    • What were the phenotypes of these parent individuals?
  • Now with the gene symbols chosen, scholars create one or more Punnett square(s) that will test their hypothesis (i.e., show the predicted outcome of the parental cross that led to the gummy bears in their bag). Scholars answer the questions below in their Lab Notebooks:
    • How closely does your actual data approximate the ratio predicted by your Punnett square?
    • Is your hypothesis confirmed by the evidence? If not, repeat steps 2–4. You must show all work to receive full credit.
  • Scholars determine the probable modes of inheritance for each bear phenotype observed in class and complete the second table in their Lab Notebooks.
  • As scholars are working, circulate and press those who are struggling to apply their knowledge from previous lessons.

Discourse Debrief activity:

  • Scholars share their data from the second table with the class.
    • Allow discourse in areas where scholars disagree (such as around the inheritance pattern of the yellow bears).
  • Ask scholars to explain the difference between codominance and incomplete dominance.
    • Be sure to explain/model how the symbols used are different.
      • Model thinking work using new knowledge of codominance with a Punnett square problem.

Make broader connections:

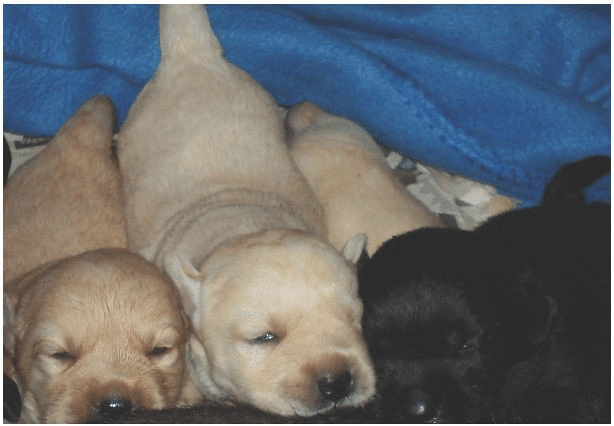
  • Return to the puppies from the beginning of the lesson. Show the following photo:
Picture20

Image credit: Ginsten, CC BY_SA 3.0, via Wikimedia Commons

•Explain that the parents had another litter of puppies. Have scholars revisit the class’s original hypotheses to see if they still agree, and share their takeaways.

Accountability (Exit Ticket)

1.Compose an answer to the unit’s Essential Question: Do I have more in common with my friends or my family? Include a detailed explanation with at least three pieces of evidence from the unit.

To decide whether one has more in common with friends or relatives, they must first decide what “in common” means to them. Ultimately, I’d argue you have more in common with your family because of your genetic connectedness.

If you’re talking about your hobbies, your taste in music, or your fashion sense, it’s safe to assume that you have more in common with your friends than your family. Members of a family usually span a wide range of ages and come from several different generations. It’s unlikely they’re all listening to the same songs or wearing the same style of clothing.

However, if you define “in common” more scientifically, you might have a lot more in common with your parents, aunts and uncles, and siblings than you realize. When you are born, you already come with thousands of traits encoded into your DNA. Before your friends ever come into the picture, a lot of what makes you “you” is already determined! Maybe you got your dad’s eyes or your mom’s nose, or the same freckles as your grandmother (although they seemed to “skip a generation”). This is all because of your genes.

When a new human (or other organism created through sexual reproduction) forms from male and female sex cells, it inherits alleles for each gene from both parents. These alleles make up chromosomes that code for everything from skin color to earlobe shape. In addition to physical characteristics, offspring can inherit mental traits and even some diseases! Because of these patterns of inheritance, you are much more genetically similar to your parents or siblings than to any of your friends. Thus, you have more in common with them, even if it doesn’t always seem that way….

Scoring Award points as follows:

  1. Award one point for each of the following:
    • A clear claim that is supported by evidence
    • Including at least three strong, scientifically accurate pieces of supporting evidence from the unit (up to three points)

Unit Vocabulary

Vocabulary List

  • offspring
  • heredity
  • gene
  • mitosis
  • meiosis
  • gamete
  • somatic cell
  • chromosome
  • sexual reproduction
  • asexual reproduction
  • fertilization
  • DNA
  • generation
  • phenotype
  • genotype
  • allele
  • heterozygous
  • homozygous
  • dominant
  • recessive
  • Punnett square
  • codominance
  • incomplete dominance
  • pedigree chart
  • specialized cell
  • mutation
  • genetic engineering
  • selective breeding

resources

Related content

Access a wide array of articles, webinars, and more, designed to help you help children reach their potential.