orange icon book

Earth and Space Science: Unit 2 – Catastrophic Events: Lessons

Lesson 1: What Are Natural Disasters?

Lesson Objective: Scholars understand that studying natural disasters is important because it helps us assess risk and take preventative measures to ensure our safety.

Materials Needed

  • For each group: chart paper, markers

Prep

What are scholars doing in this lesson?

  • Scholars are introduced to the Essential Question and brainstorm its answer in addition to the larger importance of studying natural disasters.

Do Now

Launch

  • Ask: What is a natural disaster? What are some examples of natural disasters?
  • Explain that this unit will focus on non-weather-related catastrophic events, specifically earthquakes and volcanoes. To introduce these events, show the Nepal Earthquake video (2 minutes and 22 seconds) and the Japan Volcanoes video (2 minutes and15 seconds).
  • Ask: Do you think natural disasters are a threat to New York City? Why or why not? Why do we study them?

Activity

Discourse Debrief activity:

  • Have scholars share ideas they brainstormed during the activity.

Make connections to the Essential Question:

  • Introduce and discuss the unit’s Essential Question:
    • Do New York City residents need to worry about earthquakes and volcanoes?

Make broader connections:

  • Ask: How can people prepare for earthquakes and volcanic eruptions?

Accountability (Exit Ticket)

  1. Identify a natural disaster we learned about today, and explain why it’s important for scientists to study natural disasters. [3]

Today in class we learned about earthquakes. Earthquakes happen when there is movement in the Earth’s crust that causes the ground to shake violently. It’s important that scientists understand earthquakes because they are very dangerous. They cause destruction to houses and buildings, so knowing about them can save lives. If scientists know how earthquakes impact our surroundings, they can teach people the best way to stay safe when disaster strikes.

Scoring Award points as follows:

  1. Award one point for each of the following:
    • A claim that identifies either earthquakes or volcanoes and offers a valid reason to study them
    • A piece of evidence that explains why natural disasters are dangerous using information from class discussion or other past experience
    • Justification/reasoning that explains that scientists can use their understanding of natural disasters to keep people safe during an earthquake

Lesson 2: Mapping Natural Disasters

Lesson Objective: Scholars understand how proximity to a tectonic plate boundary determines the likelihood of a natural disaster occurring in a given location.

Materials Needed

  • For each group: maps (earthquake, plate boundary, volcano), 4 highlighters, 4 markers or colored pencils

Prep

What are scholars doing in this lesson?

  • Scholars study patterns in different maps to investigate whether earthquakes and volcanoes occur in predictable locations.

Do Now

Launch

  • Have you ever felt an earthquake or experienced a volcano? Where were you? What was it like?
  • Where do these events happen? Do these events even happen in New York?
  • Show scholars how to determine latitude/longitude and ensure that they can read a compass rose.
    • Elicit from scholars the reasons why we have developed the mentioned systems for describing precise locations on Earth.

Activity

  • Scholars examine maps to determine whether earthquakes/volcanoes occur in predictable locations.
    • Scholars examine the three maps to discover correlations among them.
    • Scholars record their findings and transfer them to the map in their Lab Notebooks.
  • As scholars are working, circulate and press them to explain the patterns they notice in the data.

[Materials Management Tip: Give scholars whiteboard markers so they can mark up the maps. Because they are laminated, they can be easily erased!]

Discourse Debrief activity:

  • Ask: What areas experienced earthquakes and volcanoes?
  • Ask: What do these areas have in common? Define fault and hot spot.

Make connections to the Essential Question:

  • Ask: Refer back to the Essential Question. Based on the map, is New York likely to experience an earthquake or a volcanic eruption? Explain.

Make broader connections:

  • Ask: Why is it important for scientists to study these patterns?

Accountability (Exit Ticket) Directions: Use the reference maps to help you answer the question. You may also reference a map of the United States.

volcanic hazards

  1. Is lower Texas in danger of volcanic or earthquake hazards? Explain and justify your response. [3]

Lower Texas is not in great danger from these hazards. As seen on the map, lower Texas shows the lowest probability of earthquakes and shows no danger of volcanic hazard. This is because Texas is not located on a plate boundary. Earthquakes and volcanoes develop on plate boundaries where plates are moving toward, away from, or past each other. Because Texas is not near one of these boundaries, it is less likely to experience these activities.

Scoring Award points as follows:

  1. Award one point for each of the following:
    • A claim that identifies that the risk level is low
    • One piece of evidence with relevant information from the earthquake hazard map and the volcano hazard map
    • Justification/reasoning that explains that earthquakes and volcanoes result from plate boundary movements

Lesson 3: Shaky Ground

Lesson Objective: Scholars know that every earthquake has a predictable sequence of waves: P- waves, then S waves, then surface waves. The waves travel from the focus of an earthquake, outward in all directions to the Earth’s surface.

Materials Needed

  • For each group: 1 metal Slinky with tape markers (see Materials Prep, below)

Prep

  • Materials Prep:
    • Apply four evenly spaced tape markers to each Slinky to represent buildings on Earth’s surface. Markers should all be on the same side of the Slinky so they can “stand upright” during the simulations.
    • Understand how to model P-waves, S waves, and surface waves using a Slinky. Refer to the animation linked within the Investigation section for guidance.
  • Intellectual Prep:

What are scholars doing in this lesson?

  • Scholars use a spring as a model of earthquake waves to better understand that the vibrations caused by earthquakes are due to unique seismic waves.

Do Now

Launch

  • Show the National Geographic Earthquake Montage video (47 seconds).
  • Ask: How does the ground appear to move during an earthquake?
  • Explain:
    • Earthquakes produce vibrations called seismic waves. These waves travel away from the focus of the earthquake, releasing energy in all directions.
    • Every earthquake has a predictable sequence of waves. Primary waves come first, then secondary waves, then surface waves.
      • Primary and secondary waves are called P- and S waves for short.
      • P- and S waves move through the Earth’s mantle, but surface waves only move through the Earth’s crust.

Activity

  • Display these animations of P-waves, S waves, and surface waves. Scholars should reference this animation and attempt to develop a method to replicate each wave type using their Slinky.
  • Scholars use their springs to model earthquake waves. Scholars move their spring in different ways to replicate P-waves, S waves, and surface waves.
    • Reinforce vocabulary (amplitude) as scholars work.
    • Scholars use their tape markers to model buildings on the Earth’s surface.
    • Scholars analyze the effects each wave type has on the tape markers.
    • Scholars record their observations.
  • As scholars are working, circulate and ensure that they all can articulate the path taken by earthquake waves as well as the three types of waves.

[Tip: Consider moving the lab tables or finding a larger open space to use during this time.]

Discourse Debrief activity:

  • Ask one group that was successful to model their P-, S, and surface waves.
    • What differences do we see between the waves? What do they have in common?
      • Define focus.

Make broader connections:

  • Ask: Which wave would be most destructive to a building? Explain.
  • After scholars discuss, explain that surface waves have more amplitude. If helpful, show scholars a seismogram and point out the surface wave.

Make connections to the Essential Question:

  • Ask: Consider our Essential Question. How well do you think New York’s buildings would withstand an earthquake? Why?

Accountability (Lab Notebook)

  • Study scholars’ Lab Notebooks. Look for misconceptions in their models, and make a plan to circle back with scholars throughout the unit to see if they have been corrected.

Scoring Award points as follows:

  • Score scholars on a 1–4 scale (below expectations through exceeding expectations) based on classwork. Do not penalize scholars for initial misconceptions about content rate them on effort and writing.
    • Look for the following when scoring scholar responses:
      • Clear articulation of the path taken by earthquake waves using a model
      • Clear labels with use of vocabulary
      • High effort shown in writing, with complete sentences and proper grammar/ punctuation seen throughout the observations

Lesson 4: Volcano Formation

Lesson Objective: Scholars understand that the viscosity of magma affects a volcanic eruption and volcano structure formation. Viscous magma flows more slowly and can cause an immense amount of pressure to build up, leading to a violent and explosive eruption.

Materials Needed

  • For the teacher: 1 bottle of molasses (SDS), 1liter of water, 1 bottle of vegetable oil (SDS)
  • For each group: 1 cup of baking soda (SDS), 1 cup of vinegar (SDS), 1 cup of high-viscosity “magma,” 1 cup of medium-viscosity “magma,” 1 cup of low-viscosity “magma,” 3 paper plates, 1 permanent marker, 4 straws, 1 ruler, goggles, food coloring for “magma” samples (optional)

Prep

  • Materials Prep:
    • Make a batch of each type of “magma”:
      • Low-viscosity “magma” – ¼ cup flour and 55 mL water
      • Medium-viscosity “magma” – ¼ cup flour and 40 mL water
      • High-viscosity “magma” – ¼cup flour and 30 mL water
    • Pour 50 mL of baking soda into a small cup for each group
    • Pour 50 mL of vinegar into a small cup for each group
  • Intellectual Prep:

What are scholars doing in this lesson?

  • Scholars construct their own model of a volcano to observe the effects of a volcanic eruption. They also experiment with different viscosities of magma to observe the effect on volcano structure.

Do Now

Launch

  • Start with a visual or video of a volcano. Directly review with scholars:
    • Definitions of lava and magma
    • How volcanoes form
  • Show students the following images and discuss:
    • Why might these volcanoes look so different?
Mount St. Helens (WA) Upolu Point (HI) Mount Etna, Sicily, Italy

Mount St. Helens (WA)

Upolu Point (HI)

Mount Etna, Sicily, Italy

Image credit: All photos are courtesy of the United States Geological Survey

  • Show the bottles of molasses, vegetable oil, and water. Tell scholars that each of these liquids has a different viscosity, with molasses being the highest. Tip the bottles from end to end or pour out some liquid from each and allow scholars to observe.
    • Allow scholars to discuss what they think “viscosity” might mean.
    • Before moving on, define viscosity and make sure scholars can differentiate between high and low viscosity.

Experiment

  • Scholars construct a volcano model:
    • Scholars combine vinegar and baking soda in a cup to simulate a volcano.
    • Scholars observe the results.
    • Scholars connect their observations to the buildup of gas in the Earth’s mantle.
  • Scholars test magma viscosity:
    • Scholars blow into each magma sample using straws.
    • Scholars observe and record the reactions for each magma type.
  • Scholars build volcanoes:
    • Scholars pour each lava sample onto a corresponding plate.
    • Scholars observe the lava flow for each plate and the resulting structures they build.
    • Scholars start to think about how each type of magma might create the different types of volcano shown at the beginning of class.
  • As scholars are working, circulate and press them to explain how the models help them to understand the phenomena.

[Materials Management Tip: Consider how you will organize the materials for this investigation, as there are many, and some cannot be reused by other classes.]

Discourse Debrief experiment:

  • Refer to pictures from the Launch and ask:
    • Which type of lava would create each volcano?
    • How does magma viscosity affect volcano shape?
    • How might eruption style relate to volcano type?
    • How does volcano formation differ from earthquake formation? How are they related?

Make broader connections:

  • Show the Meet the Volcanoes video (2 minutes and 57 seconds) and discuss:
    • Define shield volcano, cinder cone volcano, and composite volcano.
    • Ask: Which volcano is the most dangerous? Explain.
    • Ask: Are there volcanoes in New York? (Relate back to Lesson 2.)
    • Ask: Could volcanoes still affect us?

Make connections to the Essential Question:

  • Ask: What do we still need to know to answer our Essential Question?

Accountability (Exit Ticket) Directions: Following are images of three different types of volcanoes.

Use these images to answer the question.

Types of Volcanoes

  1. Which volcano would be the safest to live near? Explain. [3]Volcano C would be most safe to live near. This is a shield volcano, which means its eruptions mostly consist of lava flows. These volcanoes are predictable, and their lava flows are typically slow. The other volcanoes have more violent and dangerous eruptions because the built-up pressure makes them more explosive.
  2. Which statements below are true? [1]
    1. Cinder cone volcanoes form the most rapidly and they last the least amount of time.
    2. Shield volcanoes have the fastest-running lava when it erupts.
  3. Composite volcanoes have the most violent eruptions.
    1. I
    2. II
    3. III
    4. Only I and III

Scoring Award points as follows:

  1. Award one point for each of the following:
    • A claim that identifies volcano C is the safest to live near
    • One piece of evidence that explains that volcano C is a shield volcano, therefore its eruptions mostly consist of lava flows
    • Justification/reasoning that supports their evidence (Example: Other volcanoes that form differently have more violent and destructive eruptions because the built-up pressure makes them more explosive; or elaborating on shield volcanoes further)
  2. Award one point for selecting answer D.

Lesson 5: Measuring Earthquakes (Two Days)

Lesson Objective: Scholars understand that scientists measure earthquakes using standardized scales and specially designed tools. The Mercalli scale measures the shaking of an earthquake at a given location, while the Moment Magnitude and Richter scales measure the magnitude of an earthquake at its source. The energy and magnitude of an earthquake are directly proportionate to the amount of damage they cause. Areas closer to the epicenter of an earthquake can expect to receive more damage. The epicenter of an earthquake can be located by reading S-P interval graphs and using triangulation.

Materials Needed

  • Day One:
  • Day Two:
    • For the teacher: model seismogram (created by model seismograph)
    • For each group: model seismograph (such as this one)

Prep

What are scholars doing in this lesson?

  • Scholars use eyewitness accounts of an earthquake and the Mercalli scale to create isoseismal maps and attempt to locate the epicenter of the earthquake! On day two, scholars create three intensities of “earthquakes” in the classroom and use a seismograph to record the earthquake waves!


Day One

Do Now

Launch

  • Ask: How do we measure earthquakes?
    • What tools do we have?
    • What do these measurements tell us?
  • Highlight the difference between magnitude and intensity, and how they are measured. Explain:
    • We measure earthquakes’ intensity based on the damage they cause (using the Mercalli scale).
    • We also measure earthquakes’ magnitude based on the energy they release and the amount of shaking that occurs (using either the Richter or Moment Magnitude scale).

Note: The Richter and Moment Magnitude scale are similar but not the same.

Activity

  • Scholars work in groups to read through the eyewitness accounts and give them a ranking on the Mercalli scale:
    • Scholars record their findings on their maps.
    • Scholars turn their maps into isoseismal maps by drawing isolines to indicate areas with the same amount of damage. If time allows, scholars can color-code their map.
  • As scholars are working, circulate and ask them to identify patterns in the data.

[Tip: Display an isoseismal map as a reference for scholars while they work so they have an idea of what their finished product will look like.]

Discourse Debrief activity:

  • Have scholars share their isoseismal maps and discuss where the epicenter of the earthquake might have been.
  • Ask: What are the benefits and drawbacks of using this scale?

Make broader connections:

  • Ask: If a small earthquake hits New York, do you think everyone would agree on its intensity? Explain.
  • Ask: How could scientists use the Mercalli scale to protect people in the future?Explain:
    • Intensity ratings depend on human accounts. Several people may describe the same earthquake very differently.
    • Intensity ratings also depend on the area the earthquake occurred is it developed? Heavily populated? Are the structures sturdy?

Accountability (Exit Ticket) Below are three eyewitness accounts from three different locations of an earthquake that occurred in the United States.

Eyewitness Account

#1 – I was at the hardware store in town when I started to feel the shaking. The items on the shelves started to fall to the ground, and I immediately ran outside and noticed a crack in the side of the building!

#2 – I was doing some organizing in my attic and I felt some shaking. I was a little concerned, but it stopped, so I moved on. Later on that night, I asked my husband if he had felt the shaking, and he said no.

#3 – I was walking home from work, passing by the downtown area of Sacramento. All of a sudden I could barely stand, and bricks started crumbling down off buildings around me. Across the street, the bridge that spans the downtown pond even crumbled into it!

  1. Using evidence from the text above, rank each eyewitness account using the Modified Mercalli scale. Next to each ranking, identify one key characteristic that helped you determine the correct ranking. [3]

Account Rank Evidence from Modified Mercalli Scale

#1

VI

Furniture moved, cracks in walls

#2

II

Felt by people at rest/on upper floors

#3

X

Many buildings and a bridge destroyed

Scoring Award points as follows:

  1. Award one point for each row that contains a correct ranking with one piece of relevant evidence.

Day Two

Do Now

Launch

•Show the How a Seismograph Works video (1 minute and 4 seconds). Discuss:

    • What are seismographs?
    • What do they measure?
  • Introduce the lab activity by showing scholars a model seismograph and demonstrating how to handle it correctly. Do not give away how to make each type of earthquake wave, but show a sample seismogram that you created so scholars have an idea of what their final products will look like.

Activity

  • Scholars use their machines to create seismograms and observe how various intensities of “earthquakes” impact the way the seismogram looks.
    • Scholars will create three different seismograms by either shaking the table (or shaking the model seismograph, if that is preferable for safety reasons):
      • Not shaking the table at all
      • Shake the table very lightly
      • Shake the table vigorously
      • Note: Using their prior knowledge from Lesson 3, scholars will attempt to represent P-, S, and surface waves in each seismogram.
    • Scholars record their observations of what each seismogram they created looks like.
  • As scholars are working, circulate and reinforce vocabulary (epicenter, seismograph, seismogram, P-wave, S wave, surface wave).

Discourse Debrief activity:

  • Show the following image of a seismogram and discuss:
  • What are the parts of a seismogram?
  • What does an earthquake’s magnitude tell us about its strength?
  • How would magnitude change if we moved farther from the epicenter? Why?

Make broader connections:

  • Ask: Why is it important for scientists to measure the magnitude of an earthquake?

Make connections to the Essential Question:

  • Ask: How does this new information help us answer our Essential Question? What do we still need to know?

Accountability (Exit Ticket)

  1. How does a location’s distance from the epicenter of an earthquake affect the amount of damage an earthquake can cause there? [1]The closer you are to the epicenter, the greater the damage because the intensity of the earthquake will be greater.
  2. Explain your answer to question 1. Include evidence and justify your response. [2]When an earthquake occurs, it releases all the built-up energy into the area around it, which shakes the ground. As the energy travels out, some of it is transformed into other types of energy (“lost” to the surrounding environment). Therefore, as waves travel away from the epicenter, more energy is used up and the earthquake has less of an impact.

Scoring Award points as follows:

  1. Award one point for a claim that identifies an accurate correlation between distance from the epicenter and the amount of damage caused.
  2. Award one point for each of the following:
    • At least one piece of relevant evidence to support the claim
    • Justification/reasoning that is an explanation of the evidence or another relevant supporting statement

Lesson 6: The Aftermath

Lesson Objective: Scholars understand that volcanoes have tremendous effects on Earth’s surface that are not exclusively negative. They also know that lava is not the only dangerous material that can escape from a volcano ash, dust, and pyroclastic flow can also present a threat to the environment and the organisms living on Earth. However, volcanic ash contains minerals that are beneficial to plants.

Materials Needed

Prep

What are scholars doing in this lesson?

  • Scholars conduct research on the impact of volcanic eruptions throughout history to better understand their impact on Earth.

Do Now

Launch

  • Show the Volcano Movie Clip video (2 minutes and 41 seconds). Ask:
    • What are the impacts of volcanoes on people?
    • What are the impacts of volcanoes on the environment?
    • Does a volcanic eruption have any benefits?

Activity

Discourse Debrief activity:

  • Ask: What are some ways that volcanoes impact people and their environments?
  • Ask: What makes some volcanoes more dangerous than others?
    • Define ash and pyroclastic flow.
  • Ask: Are there any positive effects of volcanic eruptions? What are they?

Make broader connections:

  • Ask scholars to imagine that New York experiences an earthquake while Hawaii simultaneously experiences a volcanic eruption. Discuss:
    • What effects would you see in each area?
    • How would New York and Hawaii be impacted differently? Explain.

Accountability (Exit Ticket)

  1. Which of the following is not a negative impact of volcanic ash on the environment? [1]
    1. Volcanoes provide nutrients to surrounding soil.
    2. Volcanoes may cause destruction to surrounding villages.
    3. Volcanoes may release poisonous gas into the air.
    4. Volcanoes may trigger flash floods and rock falls.

Scoring Award points as follows:

  1. Award one point for selecting answer A.

Lesson 7: Finding the Epicenter (Two Days)

Lesson Objective: Scholars understand that seismograms and S wave–P-wave graphs allow scientists to determine the epicenter of an earthquake. Areas closer to the epicenter of an earthquake receive the P-, S, and surface waves in faster succession. It is possible to locate the epicenter of an earthquake through triangulation using data from three locations.

Materials Needed

  • Day Two
    • For each scholar: computer/device

Prep

What are scholars doing in this lesson?

  • Scholars try to calculate a location’s distance from the epicenter of an earthquake using seismograms and a travel–time graph. On day two, scholars work with real earthquake data in an online lab to determine the epicenter of an earthquake.

Day One

Do Now

Launch

  • Ask: Can you tell where an earthquake started just by feeling it?
  • Ask: Can you tell how big or small an earthquake is just by feeling it?
  • Ask: How do you think scientists determine where an earthquake began?
  • Explain:
    • It’s impossible to find an earthquake’s epicenter just by feeling it, but scientists can determine the location using multiple seismograms.
    • The seconds between a location’s P- and S waves can be translated into distance from the epicenter using a graph.

Activity

  • Scholars use seismograms and the time–distance graph (also called a travel–time graph) in their Lab Notebooks to calculate each location’s distance from the epicenter:
    • Scholars analyze each of the three seismograms.
    • Scholars try to interpret the time–distance graph using the time intervals between P- and S waves.
    • Scholars record their work.

[Tip: Because this procedure can be tricky to figure out, it’s best to have a successful group model part of their procedure during the Investigation.]

[Tip: One way to accurately determine the distance a location is from the epicenter of an earthquake while using the time–distance graph is with the index card method. Remember that it’s more important that scholars understand the meaning behind the time–distance graph; however, this is a way to supplement their use of the graph to triangulate the epicenter.]

  • After learning to read the graph, scholars should brainstorm how they could use the data alongside the map in their Lab Notebooks to determine the epicenter of the earthquake.
  • As scholars are working, circulate and ensure that all group members understand how to calculate the distance of a location from the epicenter of an earthquake using the data provided.

Discourse Debrief activity:

  • Ask: How did you interpret this graph?
  • Ask: How can we determine a location’s distance from the epicenter without knowing the direction that the earthquake’s waves are traveling?
  • Model triangulation for scholars (or have a scholar model). Ask:
    • What pattern should you look for when looking for the epicenter?
    • How should the circles look once you’ve determined the epicenter?

Make broader connections:

  • Compare and contrast triangulation to using the Mercalli scale to locate an earthquake’s epicenter.
    • Ask: Which method is more accurate? Explain.

Accountability (Lab Notebook)

  • Study scholars’ Lab Notebooks. Look for misconceptions in their responses, and make a plan to circle back with scholars throughout the unit to see if they have been corrected.

Scoring Award points as follows:

  • Score scholars on a 1–4 scale (below expectations through exceeding expectations) based on classwork. Do not penalize scholars for initial misconceptions about content rate them on effort and writing.
    • Look for the following when scoring scholar responses:
      • Clear claims that answer the questions
      • Specific evidence collected from the activity or their prior knowledge that supports the claims
      • Justification/reasoning that ties the evidence to the claims
      • High effort shown in writing, with complete sentences and proper grammar/ punctuation seen throughout the response

Day Two

Do Now

Launch

  • As a model for triangulation, have the scholars use triangulation to find something you’ve hidden in the room.
    • Hide something small (such as a sticker) somewhere in the room (under a scholar’s chair, in a bookshelf).
    • Have scholars stand in three different locations in the room. For each location, tell them how many “paces” they are away from whatever you’ve hidden.
    • Let scholars work together to figure out how to triangulate the location of the hidden object.
  • Discuss:
    • Why do scientists care about finding the epicenter of an earthquake?
    • How does this relate to what we learned about magnitude and intensity?
  • Introduce scholars to the online lab.
    • Explain that scholars smust be very precise to succeed. This online lab will require users to start over if they are imprecise!

Activity

  • Scholars complete the online triangulation lab.
    • After triangulating a location, scholars compare it to a map of the United States (they can find one online) to determine the state where the earthquake’s epicenter was.
  • As scholars are working, circulate and ask them to explain triangulation conceptually.

[Parent Investment Tip Consider printing certificates of completion to send home with scholars.]

Discourse Debrief activity:

  • Ask: Why are there circles on the map?
  • Ask: Why do you need data from at least three locations?
  • Ask: What happens at the epicenter of an earthquake?
  • Ask: How do you expect the earthquake to feel at the epicenter compared to farther away?

Make broader connections:

  • Show the When the Earth Shakes video (1 minute and 40 seconds) and ask:
    • How do scientists use triangulation data to prepare for future earthquakes?

Make connections to the Essential Question:

  • Ask: How does triangulation data help us to understand our level of risk here in New York City?

Accountability (Exit Ticket) Directions: The following map shows an earthquake epicenter as determined by the process of triangulation. Use the map to answer the following question.

process of triangulation

  1. Which city on the map likely experienced the greatest intensity of the earthquake? Explain and justify using evidence from the map. [3]

Cedar Rapids likely had the most damage because it is closest to the epicenter of the earthquake. The epicenter is where the earthquake reached Earth’s surface and where its energy was released. As the earthquake waves travel, they lose energy, so the farther away you are, the less intensity the earthquake will have. Cedar Rapids is the closest, so the waves had the most energy when hitting Cedar Rapids.

Scoring Award points as follows:

  1. Award one point for each of the following:
    • A claim that identifies that Cedar Rapids experienced the greatest amount of damage
    • A piece of relevant evidence from the map indicating that Cedar Rapids is closest to the epicenter of the earthquake
    • Justification/reasoning that supports the evidence (such as explaining that an earthquake’s energy starts at the epicenter and it decreases as it travels out through waves)

Lesson 8: Topographic Maps (Two Days)

Adapted from Play-Dough Topo activity, U.S. Geological Survey

Lesson Objective: Scholars understand how topographic maps display elevation with a consistent scale. Scholars can read a topographic map and know that reading topographic maps helps scientists identify areas that might be particularly vulnerable during an earthquake (such as areas with a steep slope where debris or lava coud flow very quickly) to mitigate damage.

Materials Needed

  • For each group: 1 3-lb bucket of clay, 1 8.5” × 11” piece of cardboard, 1 strip of thin copper wire (at least 14” in length), printer paper, 2 pencils, 1 ruler

Prep

What are scholars doing in this lesson?

  • Scholars develop their own mountain models to create a topographic map and better understand how these tools help scientists assess risk from natural disasters. On day two, scholars re-create a mountain model using another group’s topographic map!

Day One

Do Now

Launch

  • Show an image of a topographic map (such as this one from Oregon State University) and discuss:
    • What do we see on this map?
    • Has anyone seen a map like this before? Where?
    • What do you think this map shows us?
  • Explain:
    • Isolines reveal areas of equal elevation.
    • Elevation is a measurement of how far above or below sea level a location is.
    • Topographic maps display three dimensional features in a two dimensional form.
      • Use an example of “bird’s-eye view” to reinforce this image.

Activity

  • Groups create their own mountain models out of clay.
  • Mountains must be at least 12 cm tall.
  • Scholars determine how to create a topographic map of their mountain on the cardboard base.
  • Scholars label their work with units and a scale and record notes on the process.
  • As scholars are working, circulate and ask them why elevation might be an important consideration for scientists who study natural disasters.

[Parent Investment Tip: Take photos of groups posing with their completed maps to send to families!] [Engagement Tip: Allow scholars to invent a creative name for their mountain!]

Discourse Debrief activity:

  • Display an exemplary map for the class to see (map must include units and a scale):
    • Ask the group that provided the map to describe their development process.
    • Why is it important for a topographic map to have units and a scale?
  • Introduce elevation and shape as features that can be labeled. Ask:
    • Why do we want to know about elevation and shape when thinking about volcanoes?
    • What can these features tell us about the risks a volcano poses to the surrounding landscape?
    • Define slope and ask scholars to consider how the slope of a landscape might affect the area’s safety.

Make broader connections:

  • Ask: What are some ways scientists can use this information to keep people safe?

Make connections to the Essential Question:

  • Ask: How might topographic maps help us understand the level of risk in New York City?

Accountability (Lab Notebook)

  • Study scholars’ Lab Notebooks. Look for misconceptions in their responses, and make a plan to circle back with scholars throughout the unit to see if they have been corrected.

Scoring Award points as follows:

  • Score scholars on a 1–4 scale (below expectations through exceeding expectations) based on classwork. Do not penalize scholars for initial misconceptions about content rate them on effort and writing.
    • Look for the following when scoring scholar responses:
      • Clear claims that answer the questions
      • Specific evidence collected from the activity or their prior knowledge that supports the claims
      • Justification/reasoning that ties the evidence to the claims
      • High effort shown in writing, with complete sentences and proper grammar/ punctuation seen throughout the response

Day Two

Do Now

Launch

  • Review yesterday’s discussion about why it’s important that our maps are accurate and labeled.
  • Introduce today’s challenge: to rebuild another group’s mountain based on their topographic map.

Activity

  • Scholars are given a map from a different group.
  • Scholars rebuild the mountain based on the map.
  • After construction is complete, scholars answer the questions in their Lab Notebooks.
  • As scholars are working, circulate and press scholars to explain how features of the topographic map are displayed in the mountain model.

Discourse Debrief activity:

  • Scholars compare their mountains alongside the maps to assess model accuracy. Ask:
    • What does it mean when lines are close together? Far apart?
    • Where is lava most likely to flow after an eruption? Why?
    • What other volcanic hazards can we predict using a topographic map?

Make connections to the Essential Question:

  • Show a Topographic Map of New York State.
    • Talk to scholars about how this map looks different, and explain that many topographic maps use color-coding to show elevation.
    • Ask: Based on this map, does New York City’s topography present any additional concerns? Why or why not?

Accountability (Exit Ticket) [Tip: Print Reference Sheet 1 on a sheet of paper separate from Exit Ticket. Scholars may be using reference sheets for the T1 Final. This Exit Ticket provides an opportunity for scholars to practice the skill of using reference sheets to answer an assessment question.]

Reference Sheet 1: The following diagram shows a topographic map of a volcano. The contour lines show the elevation of the land above sea level. Points L, M, and N represent three different locations on the volcano.

topographic map of a volcano

Directions: This Exit Ticket is composed of two related questions about topographic maps as a tool to study volcanoes. Use Reference Sheet 1 and your knowledge of science to answer questions 1 and 2.
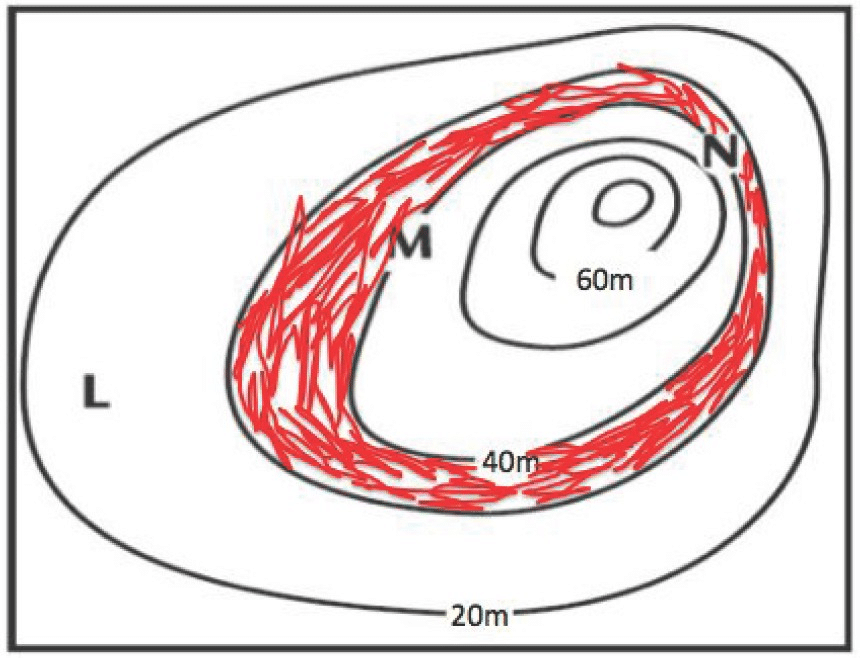
  1. Which location (L, M, or N) is most likely to experience damage from lava flows during an eruption? Explain. [3]Location N is most likely to be damaged by lava flows. The map shows that point N is on the steepest part of the volcano. This means that as the lava flows down this part of the hill, it will be flowing fastest and therefore would be most likely to reach point N before solidifying.
  2. .Shade in the area(s) shown on the map that have an elevation between 30 m and 40 m. [1]
    Picture1
  3. When walking from point M to point L, which of the following describes your journey? [1]
    1. Uphill
    2. Downhill
    3. Flat surface
    4. Uphill and downhill

Scoring Award points as follows:

  1. Award one point for each of the following:
    • A claim that identifies that location N is most likely to experience damage from lava flows
    • A piece of relevant evidence from the map that shows point N is on the steepest part of the volcano
    • Justification/reasoning that supports the evidence (such as lava flows moving down this part will pick up speed and reach N before solidifying)
  2. Award one point for correctly shading in the map.
  3. Award one point for selecting answer D.

Lesson 9: Earthquake Design Challenge (Two Days)

Lesson Objective: Scholars understand that engineers work to invent, design, build, test, and refine their new ideas in an efficient way. Purposeful improvements to structures such as buildings can prevent damage and ensure human safety during natural disasters.

Materials Needed

  • For the teacher: 10–20 sandbags/heavy weights (small resealable plastic bags each containing 250 g of sand or gram weights), 4 large binder clips, 1 timer, a table on wheels or a cart, Design Project Rubric
  • For each group: one cardboard base, 30 straws, 1 box of paper clips, 1 roll of tape, 2 clipboards, 4bouncy balls, 2 large rubber bands
  • For each scholar: link to Damage Control: Engineering web page, computer/device, copy of
    Design Project Rubric

Prep

What are scholars doing in this lesson?

  • Scholars invent, design, and build their ideas for earthquake-resistant buildings. On day two, they continue to construct their models for an earthquake-resistant building and test them using a shake table!

Day One

Do Now

Launch

  • Introduce today’s challenge and rules:
    • Now that scholars have learned all about natural disasters, they will explore one of the main tactics that scientists use to keep people safe: the design of earthquake- resistant buildings that are designed to minimize the impact of earthquakes.
    • Scholars will imagine that they have been hired as the structural engineers in charge of designing a new two-story building. The constraints and rules for this work are as follows:
      • Scholars must submit a diagram of their model earthquake-resistant building before starting construction.
      • The building must fit on the cardboard base provided.
      • Buildings must have two stories, each at least 18 cm in height.
      • Each story must support at least one sandbag without collapsing.
    • Scholars will have their own miniature shake tables to test the performance of their buildings as they work. Once construction is complete, the class will gather to test each group’s building on one large shake table. To pass the test, buildings must remain standing for 10 seconds after a simulated earthquake begins.
    • Scholars may repair any damage to their buildings in between tests and complete additional testing as time allows.
  • Demonstrate how the shake table will be used to test structures. (Shake horizontally for 10 seconds.)
  • Show scholars the materials that will be available for the challenge.

Experiment

  • Scholars read the information on the Damage Control: Engineering web page and plan how to use principles from the website to design their buildings.
    • Scholars record notes in the planning section of their challenge handout.
  • Scholars create a detailed diagram that outlines the design for their building. Designs must be shown to the teacher and approved before construction can begin.
  • Scholars are given the necessary materials to start building.
  • As scholars are working, circulate and press groups to ensure their designs meet the given constraints.

Discourse Debrief experiment:

  • Have scholars share their designs. Ask:
    • What are the strengths and weaknesses of your design? Why?
    • How have you already revised your design? Why?

Make connections to the Essential Question:

  • Scholars connect the activity to preparing for earthquakes in real life. Ask:
    • How could we use our models to prepare buildings in New York for an earthquake?

Accountability (Lab Notebook)

  • Study scholars’ Lab Notebooks. Use the rubric for the earthquake design challenge to pre- assess their team’s design by looking at their diagram.

Scoring Score scholars’ diagrams using the rubric on a 1–3 scale (below expectations through exceeding expectations). They will be able to view this feedback and revise their diagrams before you give each group a final score after day two.

Day Two

Do Now

Launch

  • Remind scholars of the challenge at hand:
    • They are to design and construct a model earthquake-resistant building using the given constraints.
  • Revisit the project rubric. Allow scholars to consider their current progress and discuss with their group whether they are on track to receive full credit. Scholars then make a plan for the day.

[Tip: Announce the time at which the building testing will begin. Display a countdown timer so scholars can reference it throughout the class period.]

Experiment

  • Groups continue building.
    • Scholars test their buildings using mini shake tables.
    • Scholars assess whether their sandbags remained intact.
    • Scholars continue to revise their designs.
  • As scholars are working, circulate and ensure all group members have an active role in construction.
  • Save time at the end of the experiment time to test the buildings on the larger shake table and allow peer feedback.

Discourse Debrief experiment:

  • Ask: What were your building’s strengths and weaknesses? What parts of your design or execution contributed to those results?
  • Ask: What revisions did you make to your building throughout this process? Why?
  • Ask: Did you notice common factors in the way successful buildings were made?

Make connections to the Essential Question:

  • Scholars connect the activity to preparing for earthquakes in real life. Ask:
    • What do your buildings teach you about design and planning?
    • How do you think your home would be affected if New York was hit by an earthquake?

Accountability (Classwork)

  • Scholars use the rubric for the earthquake design challenge to complete a self-evaluation.

Scoring Award points as follows:

  • Review scholar self-evaluations and score scholars’ work out of 12 points using the rubric.

Lesson 10: Using Historical Data

Lesson Objective: Scholars can explain how despite the minimal level of risk, both earthquakes and volcanoes may present a danger to New York City in the future.

Materials Needed

Prep

[Tip: If there is extra time in the unit, expand this lesson into two days so scholars can spend one day gathering information and preparing for the debate, and the second day can be spent entirely on the debate and reflections on the Essential Question.]

What are scholars doing in this lesson?

  • Scholars choose a side and gather information from different sources to prepare for a debate on New York City’s greatest risk for natural disasters.

Do Now

Launch

  • Ask: Which natural disaster do you think is a greater threat to New York City: an earthquake or a volcanic eruption?
  • Scholars will pick a side and use the resources provided to support their arguments.
    • Encourage scholars to take notes and highlight/mark up their resources.
    • Scholars can also use additional resources that you allow.
    • Introduce the format that scholars will use for the debate.

Research

  • Scholars read the documents and analyze the data.
  • Scholars record their evidence and analyses to form an argument.
  • As scholars are working, circulate and press them to include evidence gathered throughout the unit to strengthen their final arguments.

Discourse Debate:

  • Scholars debate the answer to the following question:
    • Which natural disaster is most dangerous to New York City?

Make connections to the Essential Question:

  • After the debate, revisit the Essential Question: Do New York City residents need to worry about earthquakes and volcanoes? Explain.

Accountability (Lab Notebook)

  1. Do New York City residents need to worry about earthquakes and volcanoes? Use at least two pieces of evidence and justify your response by explaining the evidence. [4]

I think New York City residents do need to worry about earthquakes and volcanoes.

Even though we do not normally experience powerful earthquakes here in New York City and are not particularly close to a tectonic plate boundary, we cannot predict earthquakes reliably. There is always a chance that an earthquake could be strong enough to reach New York City. The buildings in New York City aren’t always strong enough to withstand an earthquake, which could cause a lot of damage.

Volcanoes are likely a cause for greater concern. The eruption of one particularly powerful volcano (a supervolcano) could be enough to affect the entire planet! If one erupts, it could blanket the sky above New York City in ash and poisonous gases. This would kill many organisms and make it impossible for plants to complete photosynthesis, leading to mass extinctions.

Because of the reasons outlined earlier, I think New York state residents need to take earthquakes and volcanoes seriously. Volcanic eruptions and severe earthquakes may not be common occurrences here but that doesn’t mean they’re impossible. Just one could cause serious destruction to the land, buildings, and organisms here.

Scoring Award points as follows:

  1. Award one point for each of the following:
    • A reasonable claim
    • One piece of evidence from class that supports the claim
    • A second piece of evidence from class that supports the claim
    • A justification/reasoning or conclusion that explains the evidence

Unit Vocabulary

Vocabulary List

  • natural disaster
  • earthquake
  • volcano
  • compass rose
  • fault
  • hotspot
  • seismograph
  • p-wave
  • s wave
  • surface wave
  • viscosity
  • cinder cone volcano
  • shield volcano
  • composite volcano
  • magma
  • lava
  • intensity
  • magnitude
  • epicenter
  • focus
  • ash
  • pyroclastic flow
  • triangulation
  • seismogram
  • travel-time graph
  • topographic map
  • elevation
  • slope

resources

Related content

Access a wide array of articles, webinars, and more, designed to help you help children reach their potential.